 The Journal of Arthroplasty · open accessMachine Learning Using Preoperative Patient Factors Can Predict the Severity of Pain Following Primary Total Hip ArthroplastyDOI 10.1016/j.arth.2026.04.023 · 2nd of 7 authors · Read the paper ↗
Stack & methods
From the paper
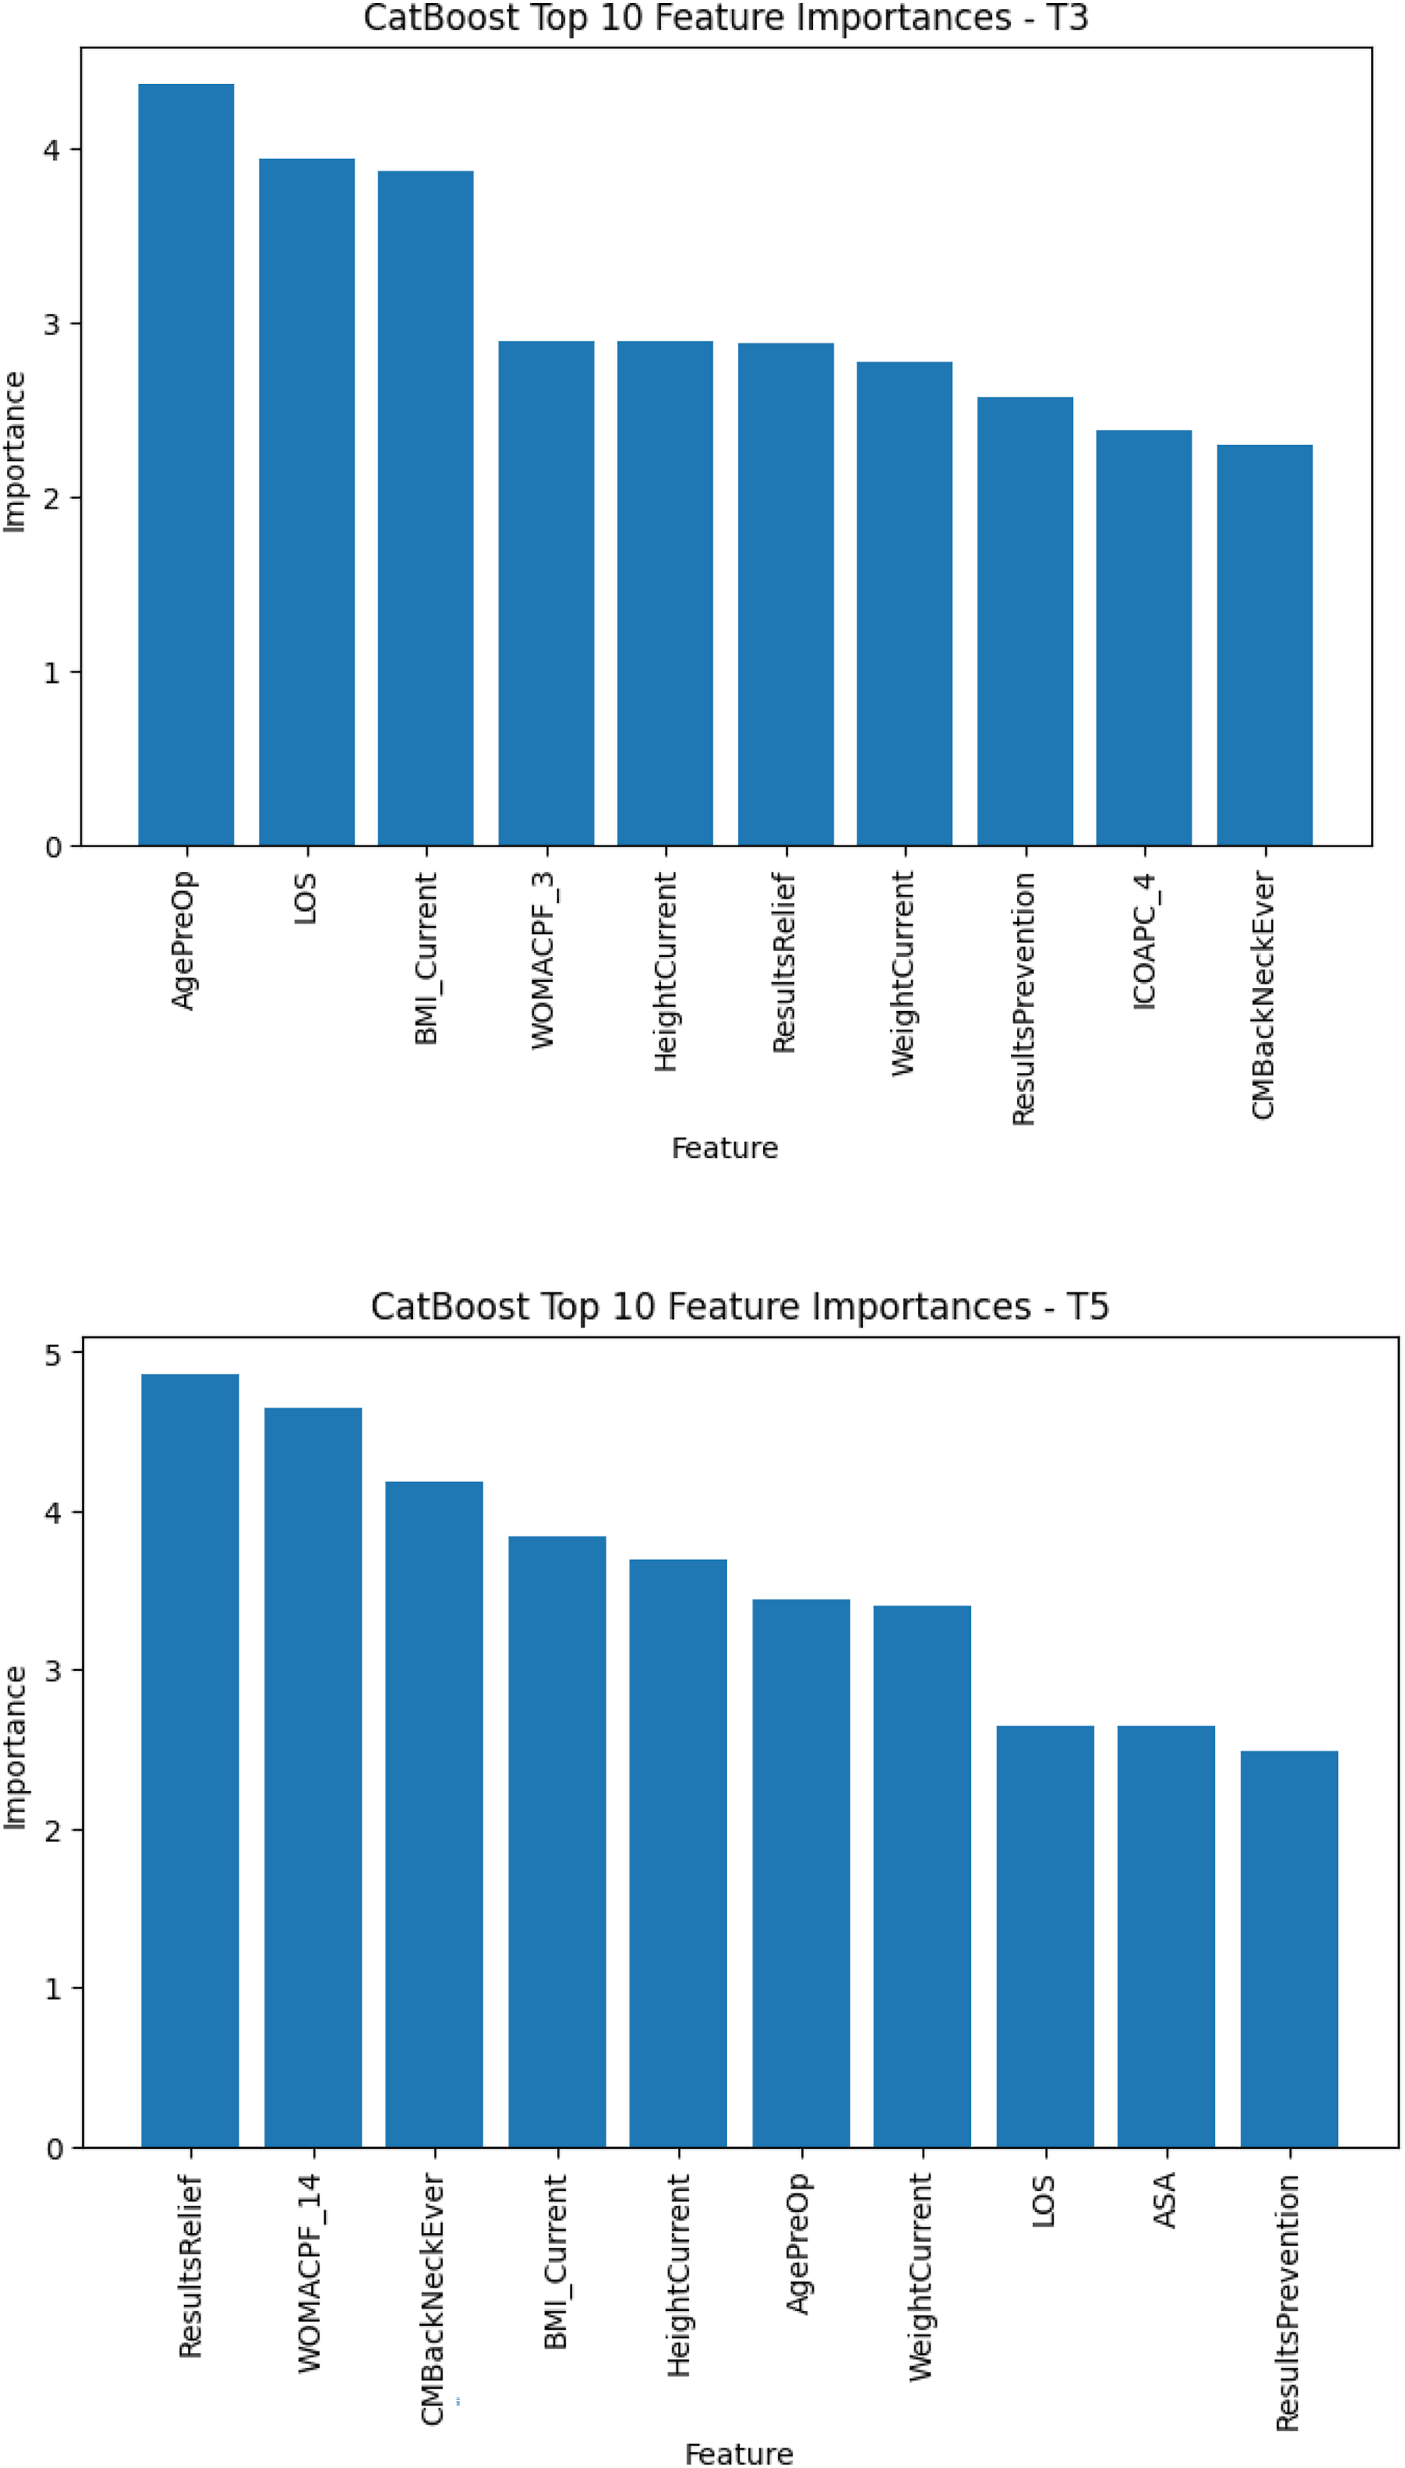
Figure 4 of the paper: what drives long-term pain in CatBoost (strongest at 5 years, and the model carried into the calculator): patient-reported pain-perception items, age, BMI, and length of stay.
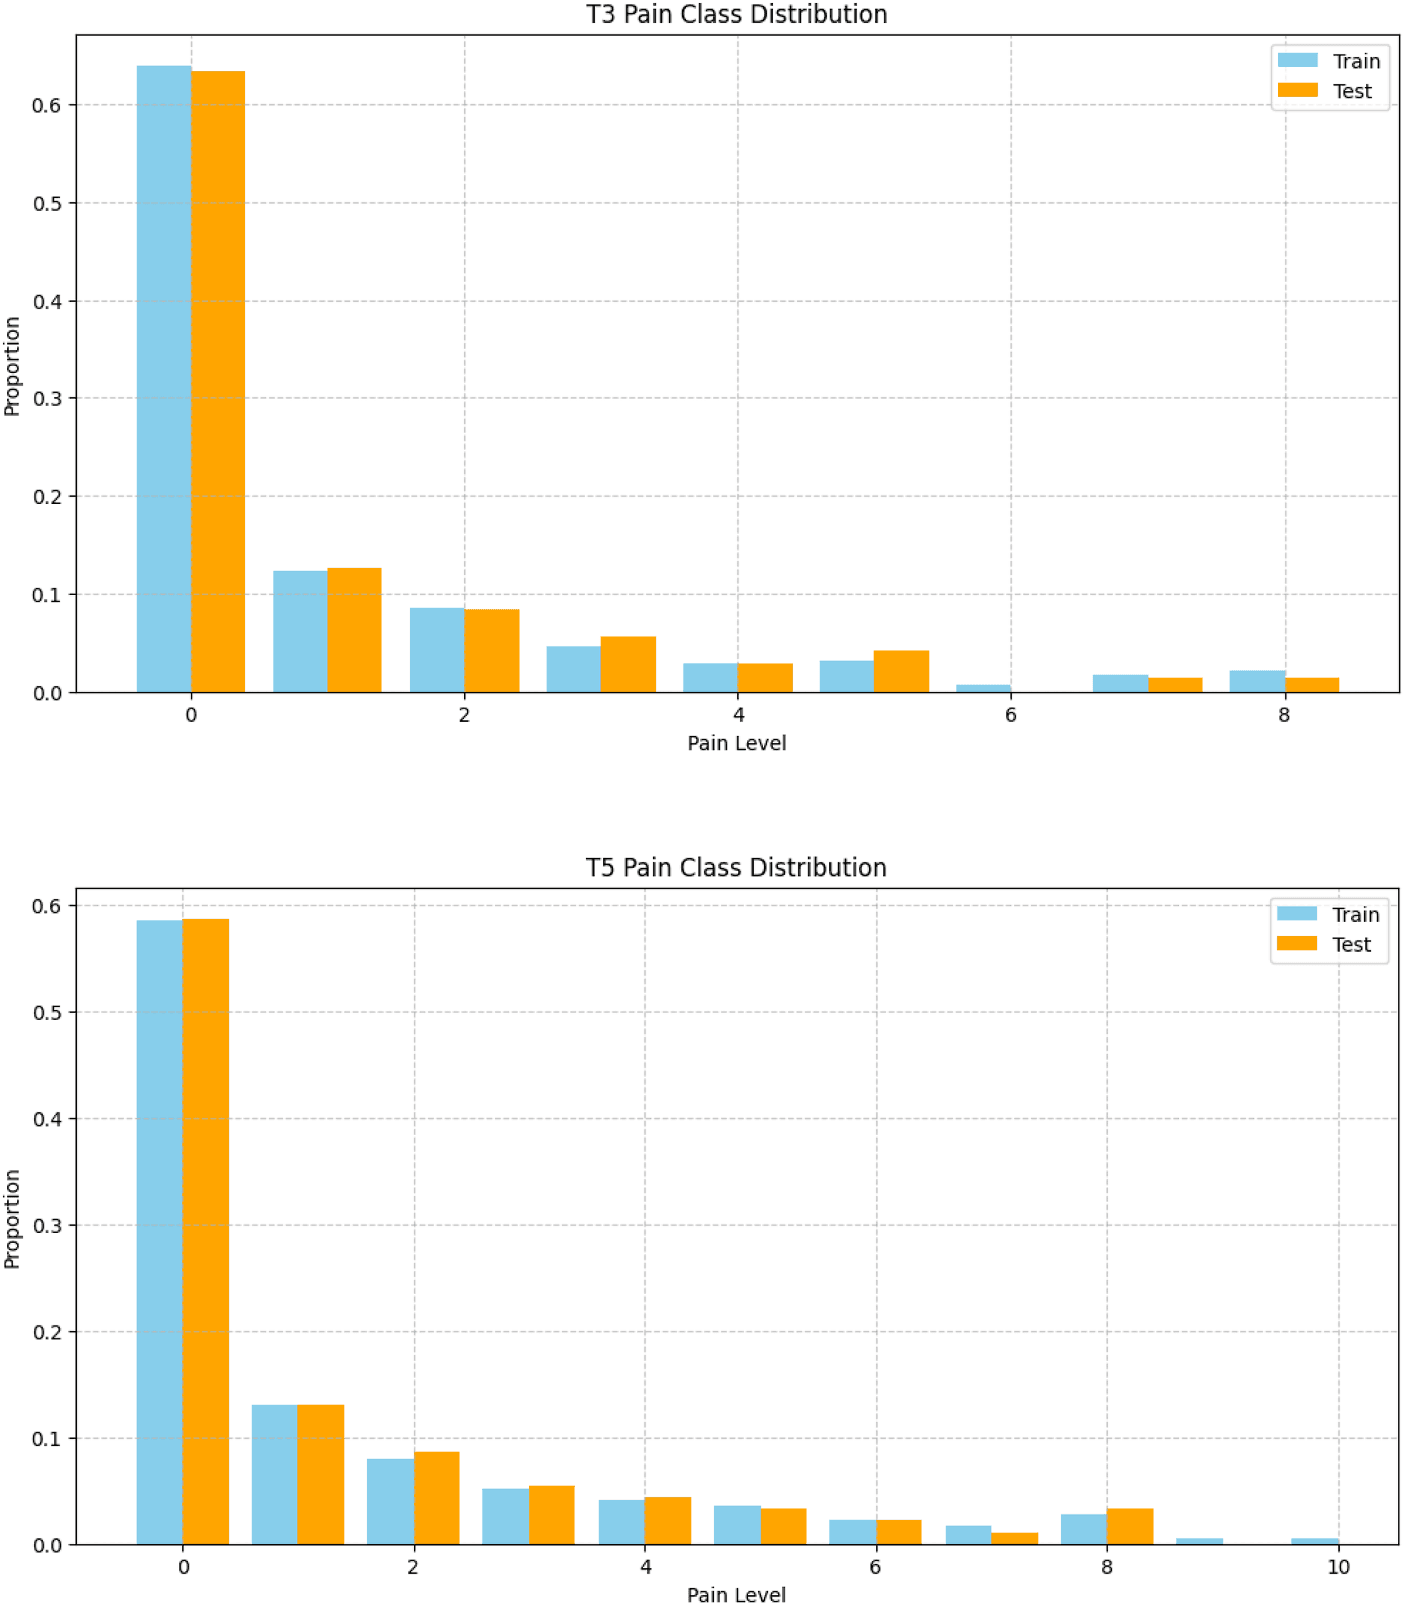
Figure 1 of the paper: the heavy skew toward zero pain. This class imbalance is why headline 'accuracy' flatters the baseline, and why the study leads with MSE and buffer accuracy.
| Model | MSE | Buffer ±1 | Buffer ±2 |
|---|---|---|---|
| KNN | 2.70 | 63.4% | 83.1% |
| XGBoost | 2.77 | 59.2% | 80.3% |
| Random Forest | 2.79 | 52.1% | 77.5% |
| CatBoost | 2.83 | 50.7% | 85.9% |
| Linear Regression | 4.20 | 42.3% | 70.4% |
| Mean baseline | 3.07 | 21.1% | 90.1% |
Where the data comes from
I didn't collect any of this data. I was the only engineer on a team of orthopaedic surgeons and researchers, and my job was to turn an existing clinical dataset into something predictive. Understanding that dataset, and cleaning it, was most of the work.
Everything runs on one cohort called SAFE-T: 513 people who had a hip replacement at two academic hospitals and were then checked in with for years afterward. Before their surgery, the usual things were recorded, their age and BMI, the details of the operation, other health conditions, and standard pain-and-function questionnaires (WOMAC and ICOAP). Then at the three-year and five-year marks, one number mattered most: how much hip pain they still had, rated 0 to 10. The model learns from the before-surgery answers to predict that later pain score, so a surgeon could estimate a new patient's risk during a consultation.
Data provenance
3 sources
Pipeline
- Keep usable slice
- Clean & impute
- Select features
- Modeling dataset
Approach
ML pipeline
- 513 patients71 preop features
- Impute + scaleiterative · robust-scale
- 13 modelslinear · trees · neural
- Select bestKNN / CatBoost
- CalculatorStreamlit tool
The dataset was Cohort 1 of the prospective SAFE-T study: 513 patients undergoing primary unilateral THA at two large academic hospitals, with data collected from preoperative baseline through five years postoperatively. Pain was measured on a 0–10 visual analog scale at 3-year (T3) and 5-year (T5) follow-ups and served as the target variable.
Feature engineering. 71 candidate features (60 numeric, 11 categorical) spanning demographics, surgical variables, comorbidities, and patient-reported outcome measures (WOMAC and ICOAP osteoarthritis pain scales). Numeric features were imputed via iterative imputation to preserve inter-feature relationships; categorical features used most-frequent imputation. Continuous variables like height and weight were robust-scaled to dampen outliers; bounded scales were normalized to [0, 1].
Model family. 13 models spanning four families: linear (linear regression, elastic net, linear SVM, SGD), tree ensembles (decision tree, random forest, AdaBoost, XGBoost, CatBoost, LightGBM), an instance-based method (KNN), and neural networks (scikit-learn MLP, PyTorch MLP). A mean regressor served as the floor-comparison baseline.
Training protocol. Stratified 80/20 train/test split, taken within each timepoint's outcome-complete subset: of the 513 eligible patients, the 3-year model used the 355 with a recorded T3 outcome (283 train / 72 test) and the 5-year model the 459 with a T5 outcome (366 / 93). GridSearchCV inside the training set to minimize MSE; the held-out test set was only touched once final hyperparameters were locked. Deep models used Adam with batch size 128.
Feature importance. Four complementary methods (Spearman correlation, Kruskal–Wallis, Random Forest importance, recursive feature elimination) were combined via cross-validated rank aggregation to identify the variables that drove the top-performing models. Age, BMI, history of back and neck problems, and specific WOMAC / ICOAP items consistently surfaced as the strongest preoperative predictors.
Problem
Total hip arthroplasty (THA) is one of the most successful procedures in modern medicine (over half a million performed annually in North America), but up to 23% of patients still report chronic postoperative pain, which contributes to higher opioid use, readmission rates, and worse overall outcomes. Identifying patients at higher risk of persistent pain preoperatively is a critical clinical challenge: surgeons currently have no validated tool to estimate this risk, and traditional regression models have struggled to capture the non-linear relationships that drive the outcome.
The collaboration with the Holland Bone & Joint Program at Sunnybrook and the University of Toronto Department of Orthopaedic Surgery aimed to (1) build and validate ML models that predict long-term pain from preoperative patient factors, and (2) translate the best-performing model into a web tool that a clinician could use during a patient consultation.
My role
Among the seven co-authors I was the only engineer; the senior team were MDs and PhDs at Sunnybrook + UofT. I led the technical implementation: feature preprocessing and imputation, model selection and training across 13 algorithms, hyperparameter search with cross-validation, the four-method feature importance pipeline, and the Streamlit calculator that surfaces the model in a clinically usable form.
Results
Non-linear models won decisively at both timepoints. Across all four metrics, CatBoost, Random Forest, and KNN were the most consistent top performers: KNN took the lowest 3-year MSE (2.70), CatBoost the lowest at 5 years (4.11). Linear models (Linear Regression and Elastic Net) had higher MSE and weaker buffer accuracy at both T3 and T5, consistent with prior orthopedic literature showing linear methods struggle to capture the non-linear relationships in postoperative-pain data.
At T3, KNN achieved the lowest MSE (2.70) followed closely by XGBoost (2.77), Random Forest (2.79), and CatBoost (2.83), all beating the 3.07 mean baseline. CatBoost had the highest ±2 buffer accuracy of any trained model at 85.9% (the mean baseline's higher 90.1% is the class-imbalance artifact discussed below, not skill). At T5, CatBoost achieved the lowest MSE (4.11), with Random Forest second (4.30).
An honest caveat on the 90.1% classification accuracy. The paper reports 90.1% classification accuracy across the low / moderate / high pain categories, but this number was also reached by the mean regressor, reflecting the heavy class imbalance in the dataset (most patients report minimal or no pain at T3/T5). The more clinically meaningful signal is the MSE gap (2.70 vs 3.07) and the buffer accuracy spread.
Clinical translation
Feature-importance analyses guided the input set for a web-based calculator that estimates expected pain severity from a small number of preoperative inputs. KNN edged the field on 3-year MSE, but CatBoost is what drives the calculator: strongest at the 5-year horizon, native handling of the categorical inputs, and the most interpretable of the top models, so its feature importances (Figure 4) are what made the input set clinically legible. The tool was built with Streamlit, deployed to Streamlit Community Cloud, and is the version cited in the published paper.
Live tool · the version cited in the paperTry the pain-prediction calculator: enter preoperative inputs, get a 3- and 5-year estimateStreamlit · CatBoost model · deployed to Streamlit Community CloudRUN ↗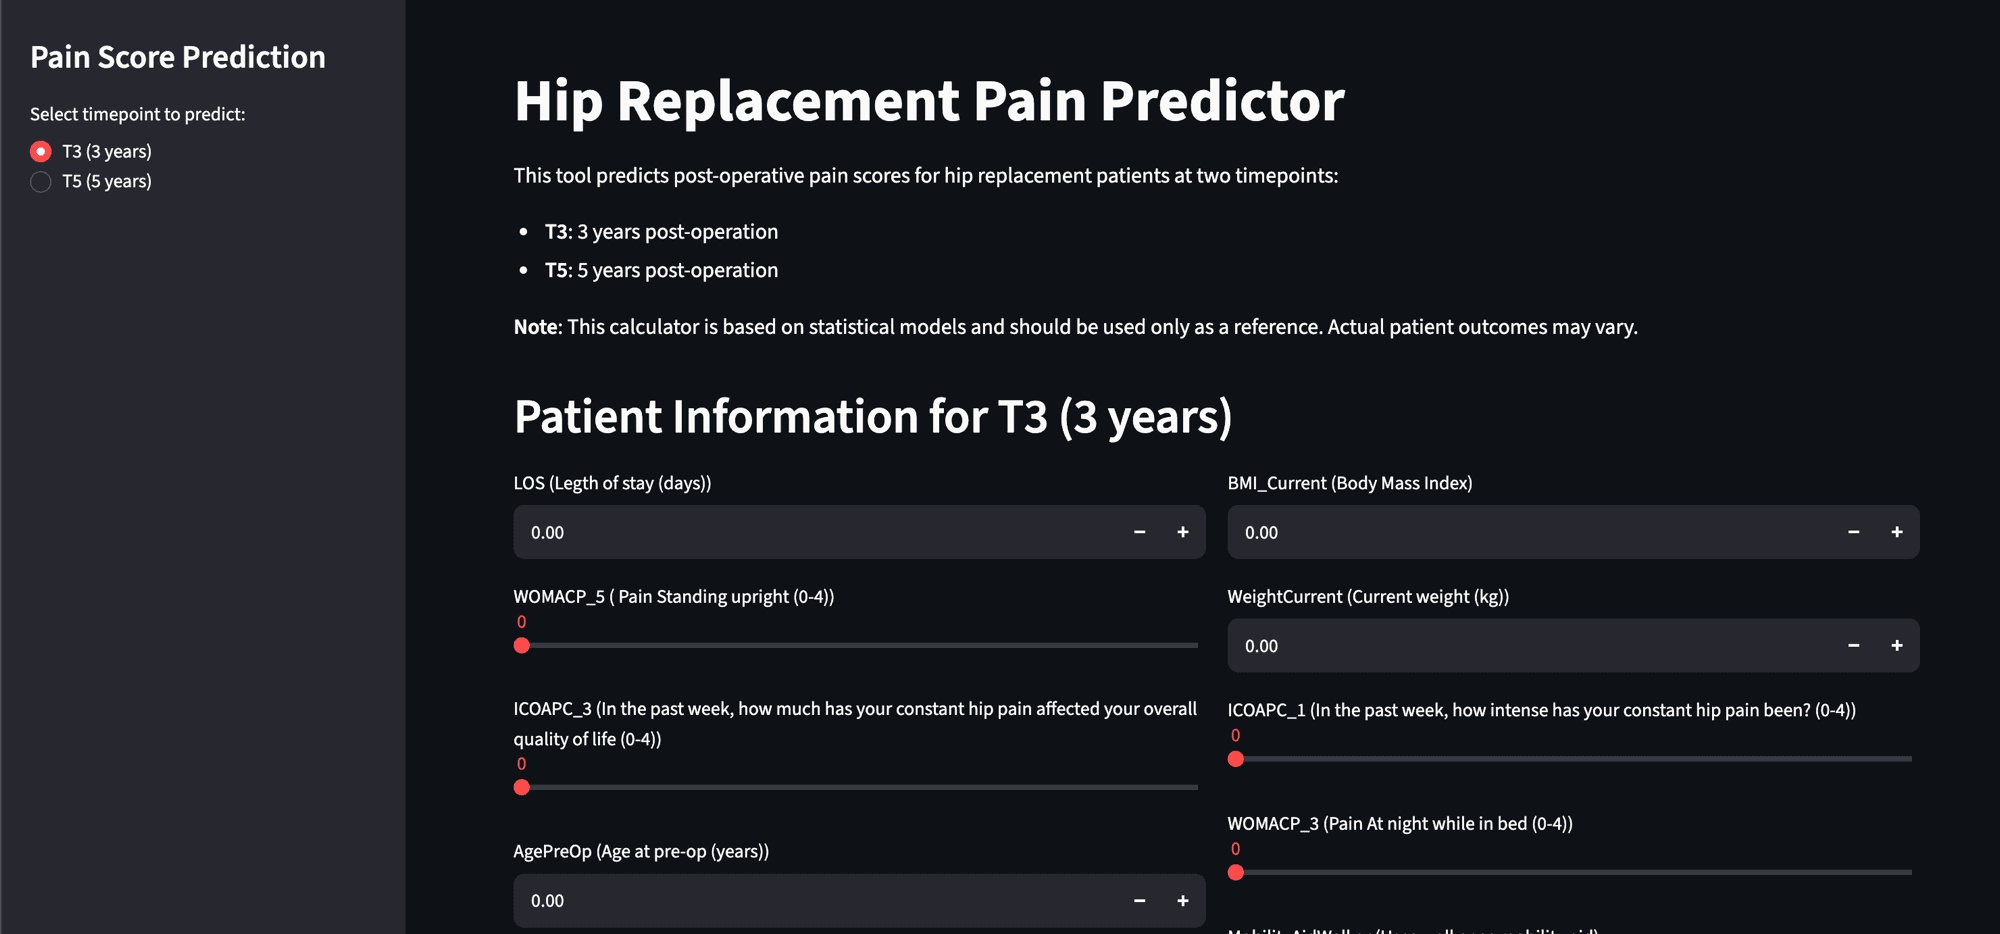
The deployed clinician calculator, the CatBoost model from the paper wrapped in a Streamlit UI: pick the 3- or 5-year horizon, enter the preoperative inputs, and it returns the predicted pain score. This is the version cited in the publication.
Tech stack
Languages & data
- Python
- pandas
- NumPy
ML frameworks
- scikit-learn
- PyTorch
Gradient boosting
- XGBoost
- CatBoost
- LightGBM
Tuning & deployment
- GridSearchCV
- Streamlit
Reflection
The biggest lesson had nothing to do with which model won: it was how much of the result was decided before any model ran. The SAFE-T cohort was real, messy clinical data: 71 candidate features spanning demographics, surgery, comorbidities, and patient-reported WOMAC / ICOAP pain scales, full of missing values and outliers. Getting meaningful predictions out of it was mostly a data problem: iterative imputation to fill numeric gaps without flattening the relationships between features, most-frequent imputation for categoricals, robust-scaling so outliers couldn't dominate, and then distilling 71 raw variables down to the few that actually carried signal using four complementary feature-importance methods pooled by cross-validated rank aggregation. The modeling was almost the easy part. On data this messy, the accuracy is won in the cleaning and the feature engineering, and it's the step I'd tell anyone starting a clinical-ML project to budget the most time for.